
The Question Nobody Asks
The financial media loves a simple headline: "You can't beat the market." But which market?
The S&P 500? The Nasdaq 100? The Russell 2000? International stocks? Bonds?
Each of these "markets" has delivered wildly different returns over every time period, and comparing an investor's portfolio to the wrong benchmark is like measuring a sprinter's time against a marathon runner's pace.
The question is not whether you can beat "the market" — it is which market are you trying to beat, and how much risk are you willing to take to do it.
Consider the annualized returns across major indexes over the past decade, through April 25, 2026.
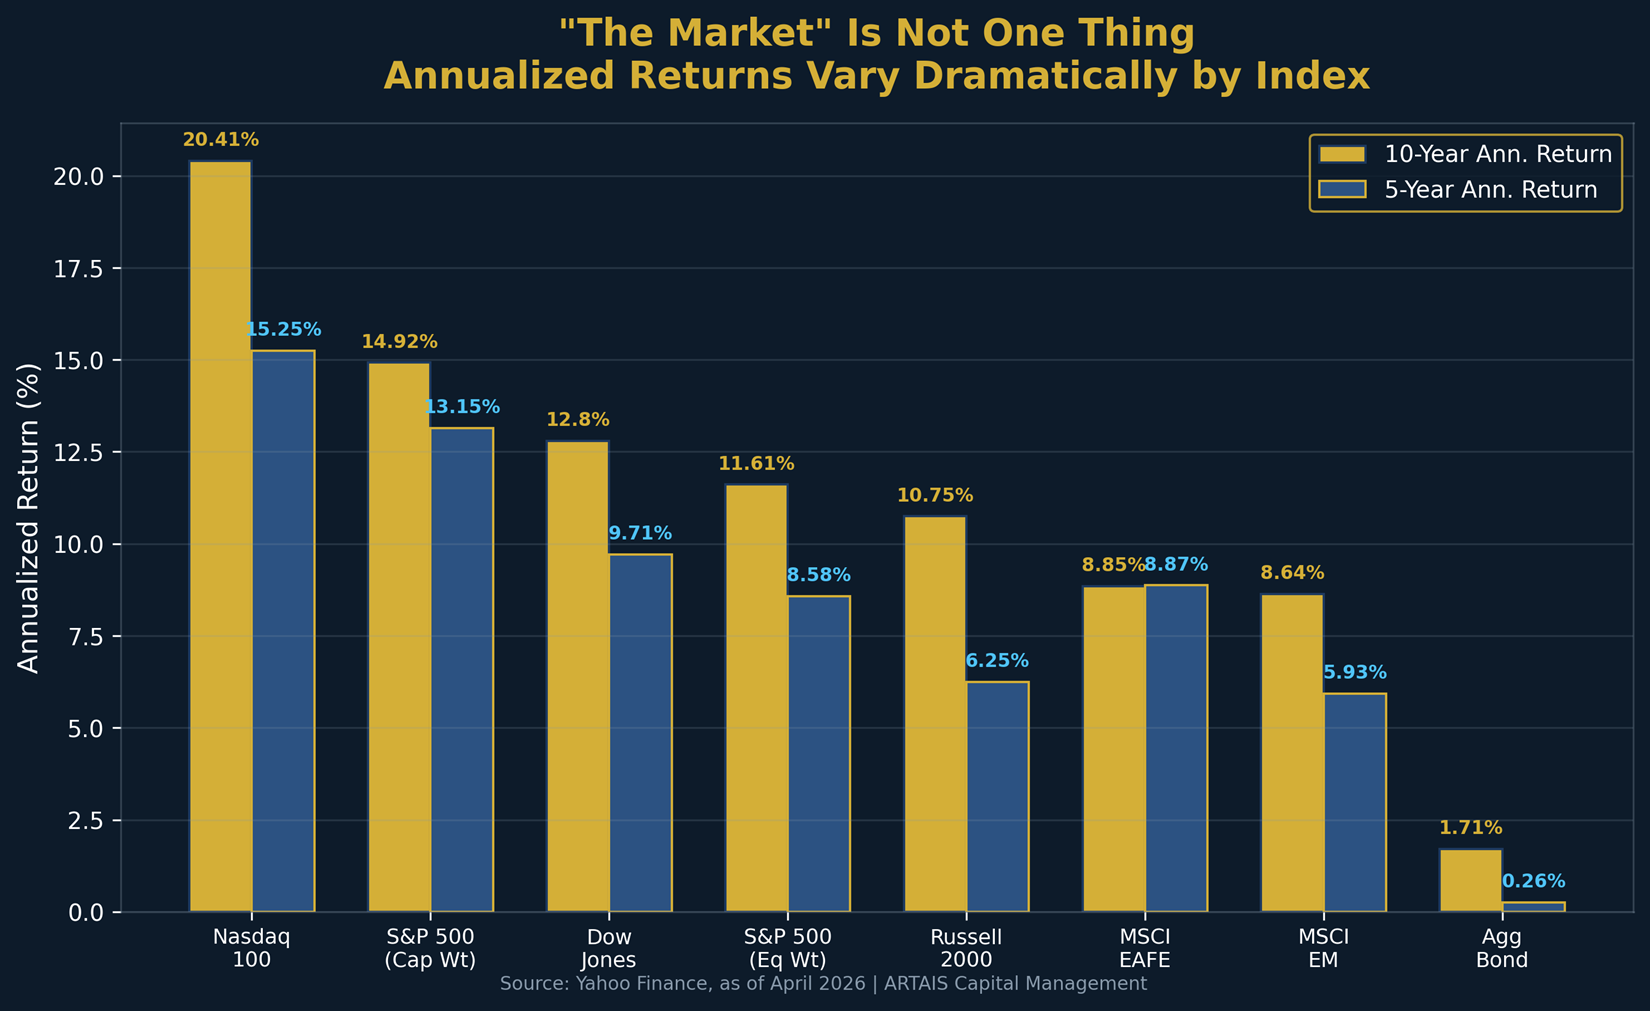
The Nasdaq 100 delivered 20.4% annualized over 10 years. The S&P 500 delivered 14.9%. The Russell 2000 delivered 10.8%. International developed markets (MSCI EAFE) returned 8.9%, and the Bloomberg Aggregate Bond Index returned just 1.7%.
All of these are "the market." An investor who beat the bond market by 5% per year would still trail the S&P 500 by nearly 10% per year.
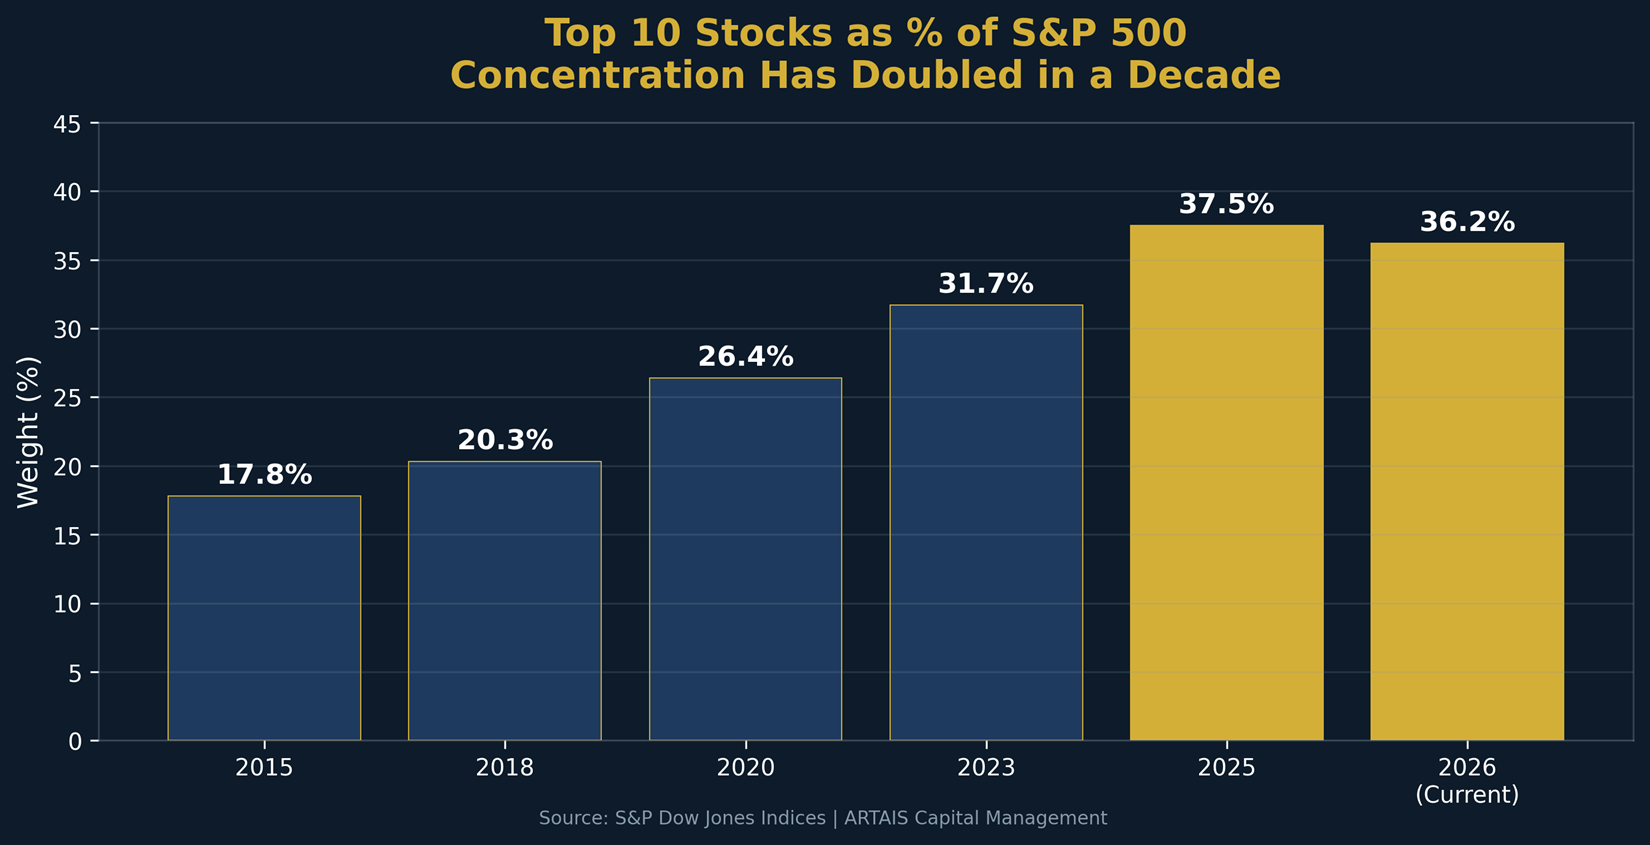
The Concentration Illusion
Much of the S&P 500's outperformance has been driven by a narrow group of mega-cap technology stocks. The top 10 holdings now represent approximately 35.6% of the index.
The equal-weighted S&P 500 (RSP), which gives each of the 500 stocks equal weighting, returned 11.6% annualized over 10 years versus the cap-weighted version's 14.9%.
This 3.3 percentage point gap means the "average" stock in the S&P 500 has actually underperformed what most people think of as "the market."
When someone says they can't beat the S&P 500, they really mean they can't beat the 10 largest technology companies. The median stock in the index has told a very different story.
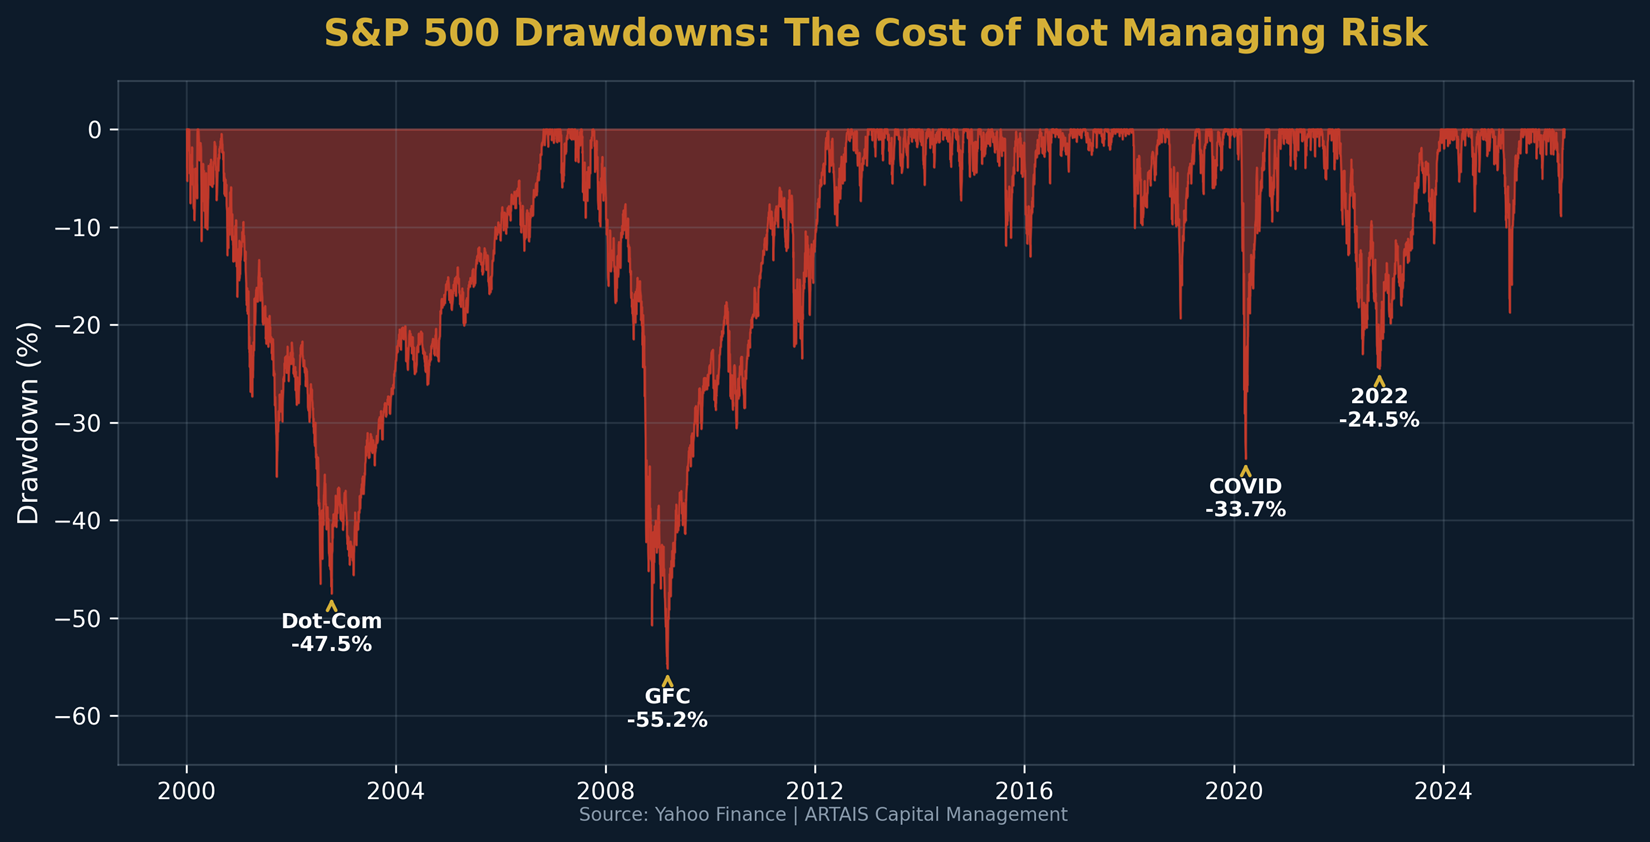
Risk Is the Price of Admission
The data reveals a consistent pattern: higher returns come with higher volatility and deeper drawdowns.
This is not a flaw in the system — it is the system.

The Nasdaq 100 (QQQ) delivered the highest 10-year return at 20.4%, but it carried annualized volatility of 22.2% and a maximum drawdown of 35.1% over that period.
The Russell 2000 (IWM) had the highest volatility at 23.0% with a max drawdown of 41.1%, yet its return of 10.8% was lower than the less volatile S&P 500.
Risk does not guarantee reward — but reward almost always requires risk.
For example, the Bloomberg Aggregate Bond Index (AGG) had the lowest volatility at 5.3%, but its 1.7% annualized return barely kept pace with inflation.
An investor seeking to "beat" this benchmark could do so with a simple balanced portfolio, but they would be taking on meaningfully more volatility to get there.
If you want to beat the S&P 500, you need to accept either more concentrated positions, more volatility, or both.
Unfortuetly, there is no free lunch. The real question is not "can I beat the market?" but rather "which risks am I willing to take, and am I being compensated for them?"
The right question isn't whether you can "beat the market", it's whether your portfolio is taking risk for the right reasons. At ARTAIS Capital, our adaptive, rules-based strategy is deisgned to navigate across market regimes, instead of trying to chase last decade's winners.
If you would like to explore what that looks like, schedule a conversation with us.
Sources
1. Yahoo Finance — SPY, RSP,QQQ, IWM, EFA, EEM, AGG, DIA historical adjusted close prices —finance.yahoo.com
2. S&P Dow Jones Indices —S&P 500 constituent weights — April 2026
3. S&P 500Concentration Risk Dashboard — ahasignals.com